> For the complete documentation index, see [llms.txt](https://dev.ubidots.com/llms.txt). Markdown versions of documentation pages are available by appending `.md` to page URLs; this page is available as [Markdown](https://dev.ubidots.com/plugins/plugins-development/getting-started.md).
# Getting started
## Widget plugin
Let's create a widget that uses the Highcharts JavaScript library to plot time series data. It will look like this:
Download the ZIP file that contains the source code for this widget from [here](https://res.cloudinary.com/di2vaxvhl/raw/upload/v1694454062/Plugin%20Assets/Widget%20plugin/CustomHighCharts.zip). Then go to Ubidots ⟶ Devices ⟶ Plugins. Once there, click the Developer console icon:
Click the + icon to create a new plugin, set a name and description, then click the done button. After that, your new plugin will be created:
Click the newly created plugin's name. In the *General information* tab, click *Add Plugin Icon* to upload the icon that will appear in the plugins drawer, then click *Save* in the *Display information* section. You can download the icon from [here](https://res.cloudinary.com/di2vaxvhl/image/upload/v1693863919/Plugin%20Assets/Widget%20plugin/highChartsLogo.png).
Scroll down to the *Plugin description* section, paste the following README, and click the *Save* button in that section.
```
# Ubidots Highcharts Widget
Visualize your Ubidots variable data using the Highcharts graphing library with this widget. Easily configure titles, axis names, and more!
## Features
- Seamless integration with Ubidots.
- Real-time fetching of variable data based on the provided label.
- Customizable graph elements like title, subtitle, x-axis & y-axis names, and the series name.
## Table of Contents
- [Ubidots Highcharts Widget](#ubidots-highcharts-widget)
- [Features](#features)
- [Table of Contents](#table-of-contents)
- [Prerequisites](#prerequisites)
- [Setup and Installation](#setup-and-installation)
- [Widget's inputs](#widgets-inputs)
- [License](#license)
## Prerequisites
- An active Ubidots account with Enterprise license.
## Setup and Installation
1. Log in to your Ubidots account.
2. Navigate to the **Dashboards** section and select the one in which you want to place the widget.
3. Click on **Add Widget** and select **HighCharts widget**.
## Widget's inputs
After adding the widget to your dashboard:
1. Configure the widget settings:
- **Chart's title**: Define the main title of the graph.
- **Chart's Subtitle**: Provide a subtitle, if needed.
- **X Axis Name**: Specify the label for the x-axis.
- **Y Axis Name**: Specify the label for the y-axis.
- **Variable Label**: Click on the "ADD VARIABLE" button and follow the variable selection wizard.
- **Series Name**: Define the label that will be displayed within the graph line.
2. Save the changes and the graph will automatically fetch the data and display it.
## License
This project is licensed under the MIT License. See the `LICENSE` file for more details.
```
Navigate to the *Version* tab in the sidebar menu. Click the "+" icon and upload the ZIP file. The plugin is now in your Ubidots account, but it still needs to be deployed.
In the *Versions* tab, scroll down to the *Version history* section and click the icon that looks like a paper airplane:
A confirmation dialog will appear. Click the *Release* button:
After that, your plugin's status will change from *Draft* to *Released*:
Go to *Devices* ⟶ *Plugins* and click the *Create new plugin* button. In the plugins drawer, search for the plugin you just created, *Highcharts custom widget*, fill in the required *Ubidots token* field, and click *Done*. After that, you will see that a new plugin has been created:
Go to the dashboard where you want to place the widget and click the *Add new widget* button. A drawer will pop up and display all available widgets. Search for the widget you just created and click it. An instance of the plugin will be placed on the dashboard:
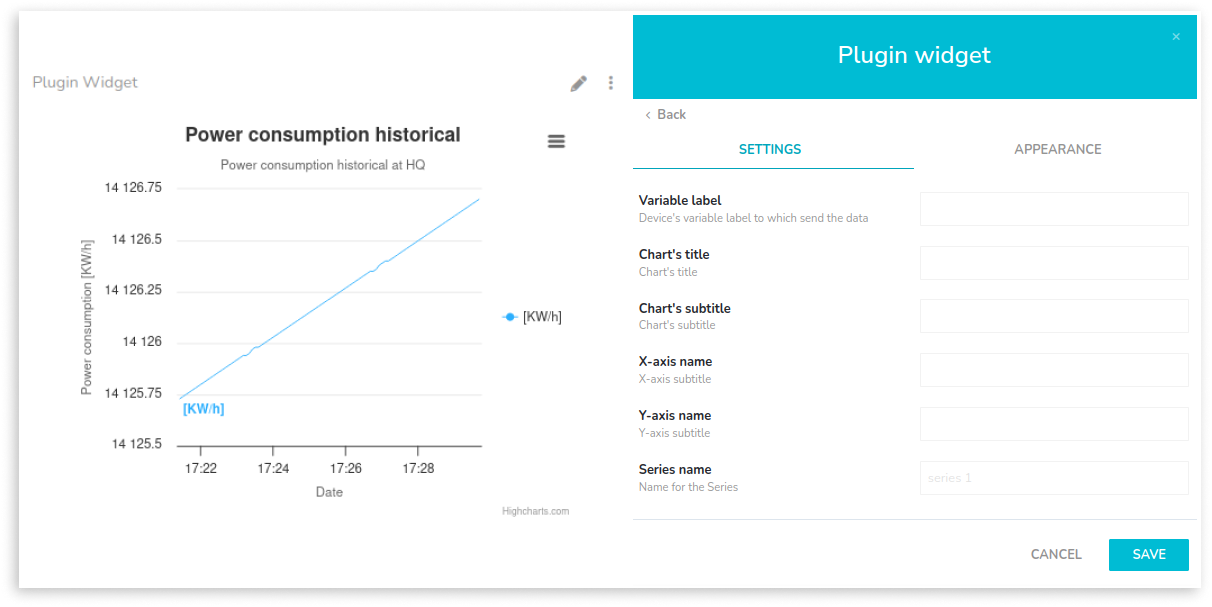
Fill in the widget fields based on the variable whose data you want to visualize. The following screenshot shows an example:
The widget is now created on the dashboard. This is how it looks:
---
# Agent Instructions
This documentation is published with GitBook. GitBook is the documentation platform designed so that both humans and AI agents can read, navigate, and reason over technical content effectively. Learn more at gitbook.com.
## Querying This Documentation
If you need additional information that is not directly available in this page, you can query the documentation dynamically by asking a question.
Perform an HTTP GET request on the current page URL with the `ask` query parameter, and the optional `goal` query parameter:
```
GET https://dev.ubidots.com/plugins/plugins-development/getting-started.md?ask=&goal=
```
`ask` is the immediate question: it should be specific, self-contained, and written in natural language.
`goal` is optional and describes the broader end goal you are ultimately trying to accomplish on behalf of the user. GitBook uses it to tailor the answer towards what is most useful for that goal.
The response will contain a direct answer to the question and relevant excerpts and sources from the documentation.
Use this mechanism when the answer is not explicitly present in the current page, you need clarification or additional context, or you want to retrieve related documentation sections.